Water Modeling Gets Interactive with GIS
Posted on Wednesday, June 5th, 2019 by Affinis CorpIn Stormwater, tagged in Tags: gis water modeling, stormwater management
At Affinis, we’ve been delivering stormwater models in a new way. Using GIS, our team is mapping locations of inlets and connecting pipes to see how they work together. The Environmental Protection Agency (EPA) developed and supports the stormwater management model EPA SWMM. This software is the powerhouse engine behind our GIS integrated models. The resulting model can be used in multiple applications, like ArcGIS, PC SWMM, and Google Earth. The model output provides detailed table outputs, as well as a visual representation that is more user-friendly.
To learn more about how it works, we interviewed Drew Pjesky, an engineering intern and Brandon Gann, a GIS specialist, on the topic. Here’s what they had to say.
How is this different than water models created in the past?
Brandon: In the past, the data was presented in a spreadsheet that required lots of manual entry. Because of how it was provided, the information included was not easily transferred from project to project, making it more of a single-use document than what we are creating now.
Drew: In comparison, the GIS water models are much easier to present. They can be integrated with Google Earth to give clients a clearer picture. From the maps, they can spatially see where things are and then, use this information for other projects. Another benefit is that it pulls all of the data into one hydraulically connected system. Before, it was all broken out separately, making it more challenging to compare multiple design alternatives.
How does it work?
Brandon: We start by surveying an area to locate storm structures and pipe segments. Then, depending on client needs, we collect supplemental information, such as condition rating and 360 degree photos. In some cases, we use our drone to produce surface GIS data for large areas. In open terrain, we can cover wide expanses efficiently.
We use that information to build a database. Visualization of the data is a big part of GIS. It is easy to have too much data. Color schemes and labels can help the client and designers see the important stuff without being overloaded.
Drew: That completed map is pulled into modeling software. PC SWMM lets us convert the GIS database into a mathematical model. The rainfall data is run through the system, and we can isolate existing or proposed results.
A cool way to see the output is in Google Earth. Every node has information embedded in it within the map. It creates an interactive experience for the viewer. Each node can be clicked on to display more corresponding data. Before, it was common to present this all in a spreadsheet. With those, it was much harder to aggregate the information and establish a sense of place, making it useful for only one project.
What are some of the ways it’s being used right now?
Drew: There are a number of ways it can be used. For example, you can print a variety of maps with relative ease and use it to identify problem areas quickly. It’s great for non-technical viewers, because, instead of massive data, it provides a picture of what’s happening. We’ve used maps to color code pipe inventory by size, show flooded pipes in red, and even show ponded water surface elevation in larger storm events.
Can you share some samples with us?
Drew: Yes, here are some sample images from work we did in Prairie Village, Kansas, along with brief explanations of the information displayed.
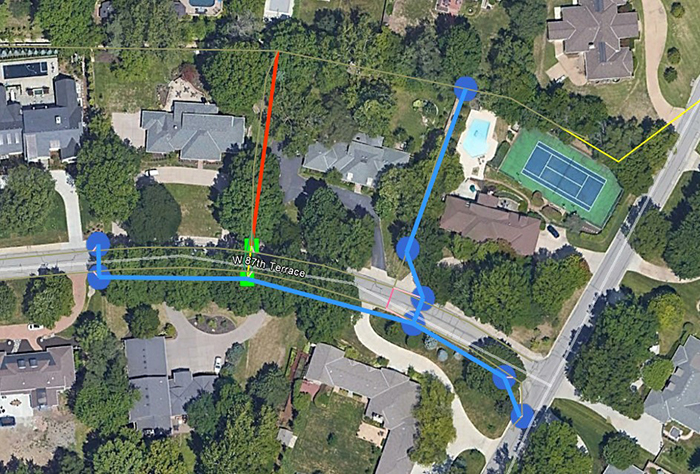
In this case, the existing flooded pipe system is shown in red, and the proposed improvements are shown in blue.
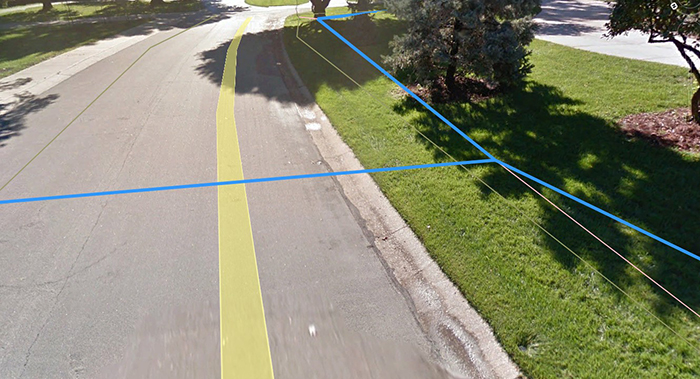
Google street view will allow the team to see potential conflicts on the ground. In this case, the blue line represents a proposed storm sewer system behind the curb impacting the small trees.
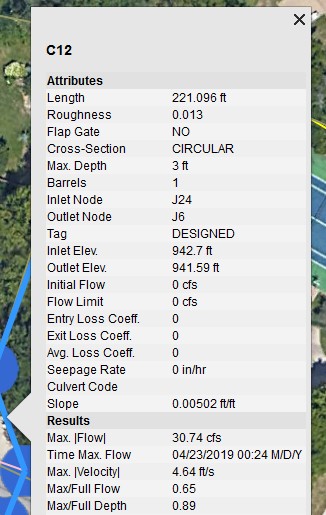
By selecting a pipe segment, the proposed design is communicated to the technical staff. This, for example, is a 3-foot diameter RCP conveying the 10-year storm at approximately 90 percent capacity.
What should cities, counties, and federal entities know about it?
Brandon: In addition to helping clients see how their infrastructure is performing, collecting GIS data is now a key component in applying for Stormwater Management Advisory Council (SMAC) funding.
Drew: While these capabilities are very beneficial, we’re always looking to the future. I think the next step will be creating dynamic 2D storm models to better estimate overland flow once the water leaves the pipes.
What are some common challenges, and how can they be overcome?
Drew: Existing GIS data can be outdated or approximate. Because of this, the quality isn’t always consistent.
Brandon: It’s important to survey, if you have access to only approximate data. Locating the structures and measuring the actual elevations will help ensure the data is accurate.
Drew: Also, some cities have more data than others, so a few are playing catch up in order to be eligible for the new SMAC requirements.