Experts Evaluate Water Quality at Over 300 Kansas City Sites
Posted on Wednesday, November 18th, 2026 by Affinis CorpIn Stormwater, tagged in
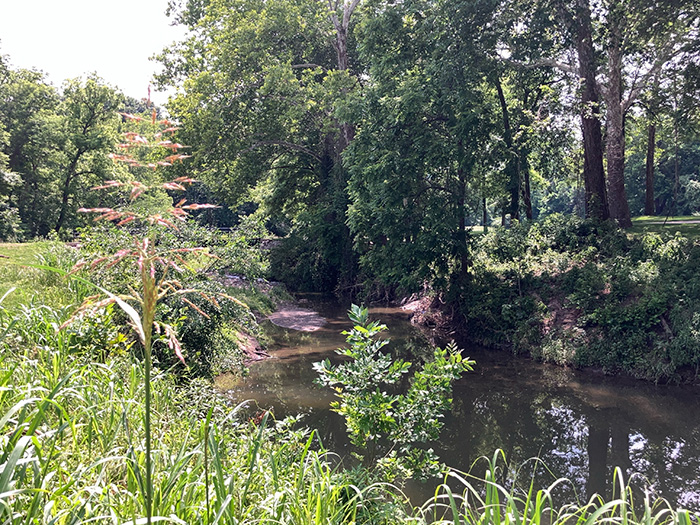
Two decades ago, the United States Army Corps of Engineers Kansas City District (USACE) and the City of Kansas City, Missouri, conducted an extensive assessment of their streams and watersheds. This summer, we partnered with Vireo to see how the environmental conditions have changed.
The KCMO Stream Assessment project included the evaluation of 373 locations. We were asked to see what was working and identify any issues, collecting data at each site. To cover the vast project area, we split our team into four groups by watershed. The two-person teams were comprised of biologists, landscape architects, and engineers, which brought diverse technical perspectives. All followed the Stream Asset Inventory (SAI) protocol, developed by Vireo for the Kansas City region.
The teams made visual observations exclusively. No chemical water sampling or laboratory testing was performed. We looked at aquatic habitat, terrestrial habitat, water quality, and stream stability. We scored each location in all four categories. Then, we compiled those numbers into an overall score for every site. Along with the ratings, our experts made note of anything interesting or unusual and took photos to document their findings.
When examining the aquatic habitat, our team noted the composition of the substrate. They looked for different macrohabitat types – pools, riffles, and runs. If all three are present, the stream supports greater biodiversity. They’d also search for different kinds of fish cover, such as overhanging vegetation; instream cover, like logs in the stream; and leaf packs.
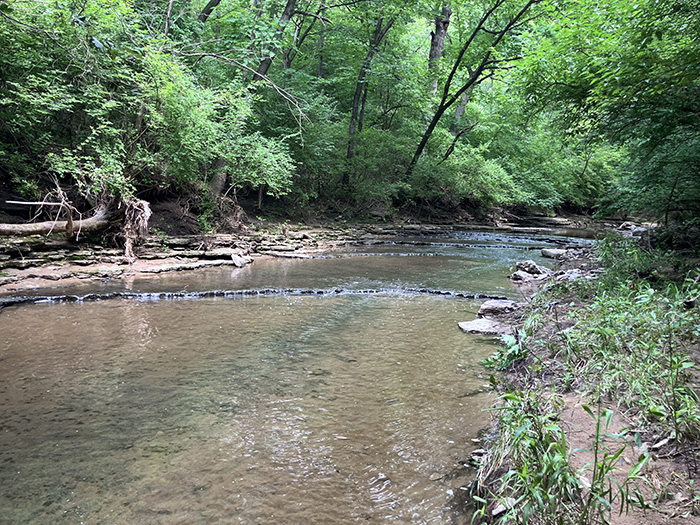
To analyze the terrestrial habitat, we looked at the riparian buffer, noting how far out vegetation was located from the stream. Vegetation in the riparian corridor helps to slow and filter overland flows. We’d also examine how the adjacent land was used, as well as the different species of trees and grasses present. Another important component was determining how much of the vegetation was invasive.
Assessing water quality was another key step. We’d look at silt cover and undesirable conditions in the water, like oil and grease, turbidity, septic odor, and trash. Another key indicator was aquatic organisms. We’d search for kinds of fish, mollusks, and amphibians. The presence and diversity of sensitive species generally indicate healthier water quality.
The last component of our assessment was stream stability. Our engineers would look at bank cut depth, which is the depth from the top of the bank to the bottom of the stream, to assess bank stability and suggest to what degree downcutting may have occurred, alongside the root depth of vegetation. Bank composition was also important. We’d determine if it was made of clay, bedrock, gravel, or a combination of materials. Finally, we’d look at erosion indicators, like bank slump, toe erosion, downcutting, and signs of overland runoff.
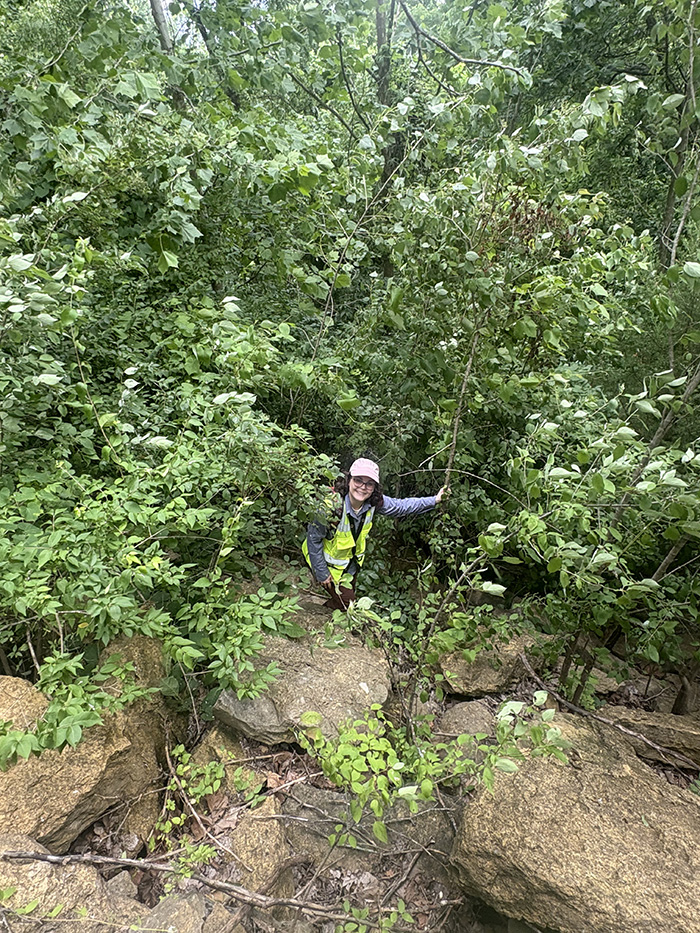
Collecting the data came with challenges. Some streams were located on private properties and getting access to these sites could be complicated. We worked with property owners to gain entry when needed.
The environment itself also posed issues. We contended with ticks, hot weather, and invasive species, as well as lots of rain. Following a storm, we would have to wait varying amounts of time to visit a site so we could collect data at baseline conditions. This was dependent on where it was located in the watershed. For example, we would wait longer to access a lower portion of the watershed following a rain event, as it had larger stream flows. This meant we often had to adjust our schedule and stay flexible to keep things moving forward.
Identifying problems in the seven watersheds allows the City and USACE to have a better understanding of what is happening in their streams. In some cases, our team provided a rare look at an area, accessing places that some property owners may not frequent. The data collected also serves as a planning tool. They can compare the information we collected with the existing data to see what has been working and what hasn’t. This allows them to more effectively allocate funds and plan future improvements.